If you follow my blog, you know here in Texas our standards changed for K-8 math this year. I feel like I am teaching a whole new curriculum. Plus, I feel like I am teaching 8th grade instead of sixth! Many of our standards moved down and it has been an eye opener for many, mostly teachers!
So, the unit I just taught kind of freaked me out. It was entitled Data Analysis which didn't seem different to me at first.
I have taught some of it, like mean, median, mode, range and graph types, some of the graphing types.
Then they threw in interquartile range, box and whisker plots, and yielded variability. I kind of freaked out about how I was going to teach this.
I looked at our new textbook and it helped a little. Then I talked with some of my math buddies and figured it was doable.
It actually turned out to be a fun unit.
Here's how it went down.
We started with vocabulary. Thankfully my students understood median, mode and range from last year. Teaching them measure of center and measure of spread was new though.
It's a vocabulary thing.
We worked on finding the IQR of data and after a while, they got it.
Then we talked about types of graphs. I love creating meaningful graphs with them.
We created dot plots with our class shoe sizes. I already blogged about those here.
We used real data from our benchmark to create stem and leaf plots. They liked this because, one I let them use a calculator, which I never do and two because it was THEIR info. They liked comparing them with the other classes too.
I had my students write their information underneath their paper.
This is where they wrote their summaries too.
Next, we talked about box plots which we also call box and whisker plots. Thankfully Miss Math Dork and Live. Love. Math came to my rescue and helped me understand it first. I was able to teach my kids step by step and it worked out great!
I created this foldable and output activity which helped a lot!
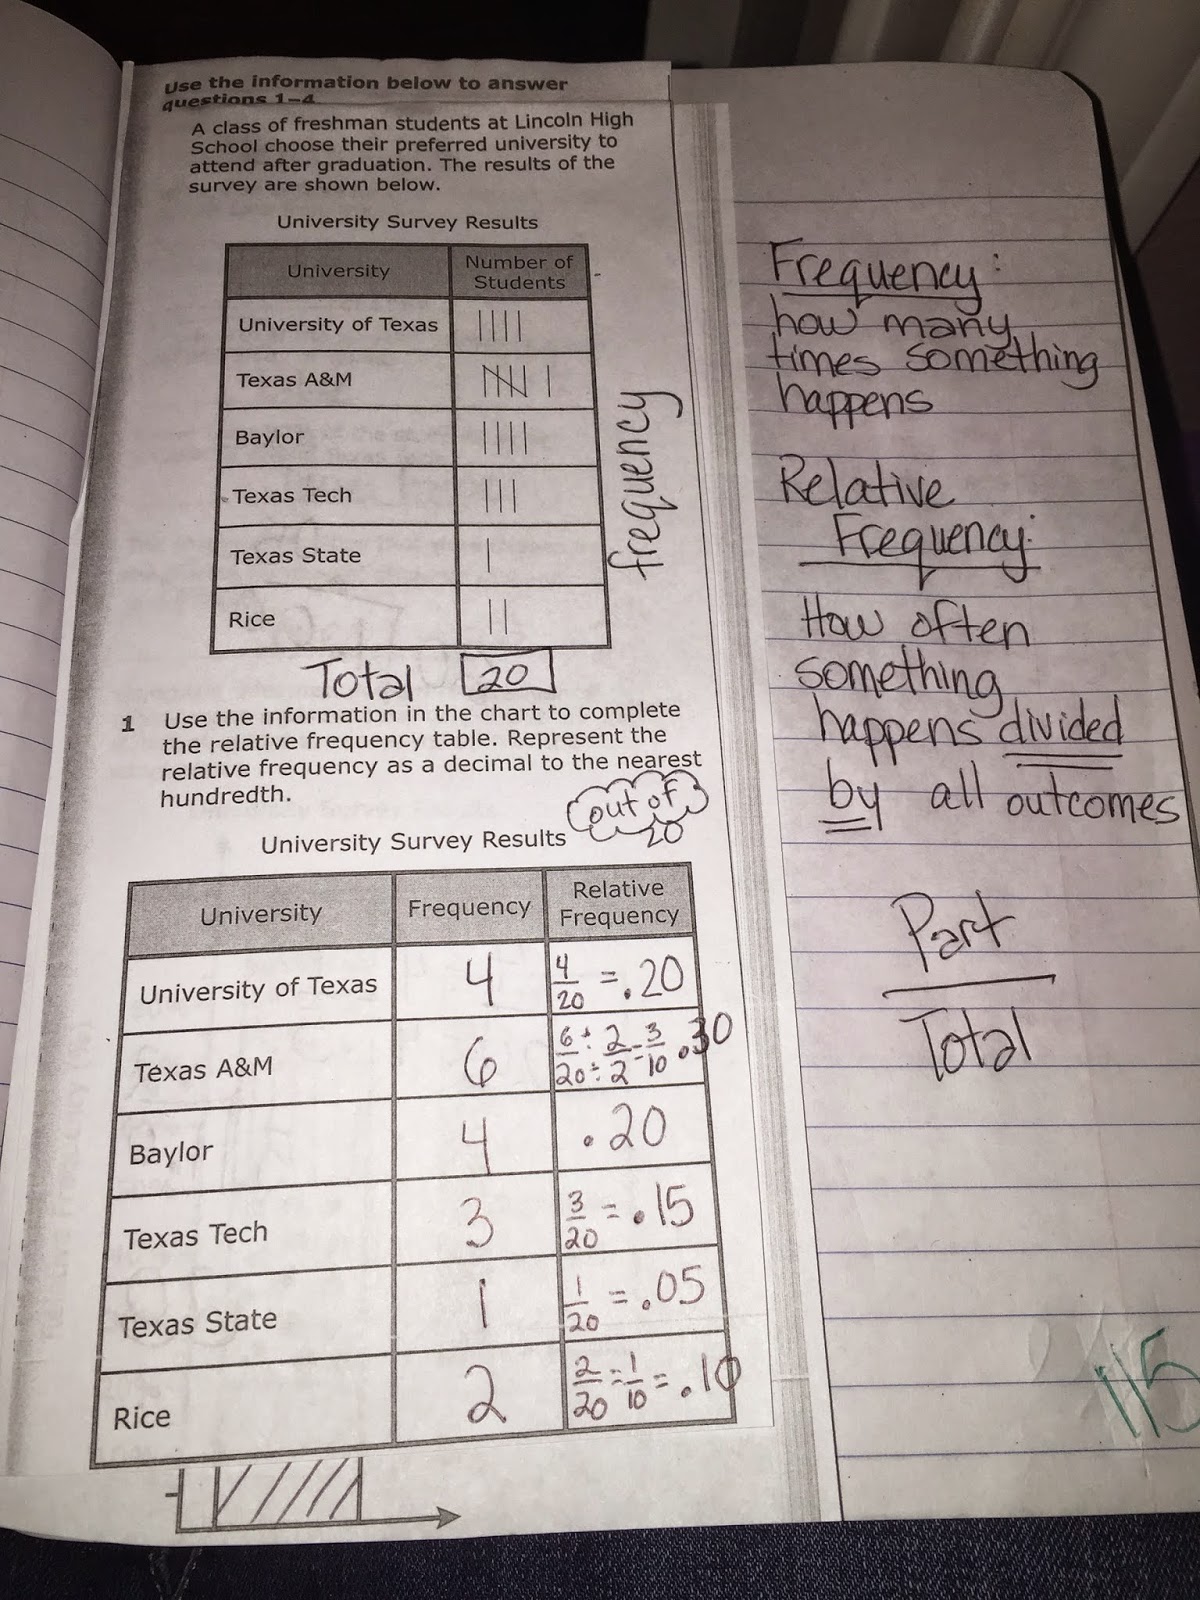
We discussed the shape and distribution of our graphs and then tackled lots of vocabulary with frequency, relative frequency, and variability.
This was our output activity. We looked all lots of different graphs and used all our new vocabulary words to write their characteristics
Next was yielded variability. Just that phrase freaked my kids out.
Once we discussed it though, they were calm.
And yes, I did use a worksheet page for frequency and relative frequency.
I liked it and it worked well. See, I don't think all worksheets are bad.
I thought variability would be hard for my kids, but once I explained it, they understood. I think it was the word that freaked them (and me) to think it was hard.
I really feel like this unit is more about vocabulary than any I have taught.
This was also a long unit for me. I am normally squeezing stuff in, but for some reason, I had plenty of time for this unit. I am actually glad it's over though, 3 weeks was too long. It will be condensed next year,
I was afraid, afraid of new, but it ended up being pretty fun and my students enjoyed it and learned a lot. Now to keep it in their brains!!! I am happy to report that for the Unit Test, I had a 91% passing rate! I was thrilled with those results!
I have some of this unit in my TpT store now if you are looking for lessons.


No comments:
Post a Comment